
System performance strong through first half of fiscal year
02/20/18 03:08:pm“We can all be proud of the success we are seeing after the first half of our fiscal year. We treated more patients than ever with positive outcomes and exceeded our financial targets. While there are still areas where we need to focus and improve, it’s important to acknowledge all the hard work that went into the results we’re seeing. Thank you for your commitment to our mission and collaboration in striving to achieve our goals.” ~ Pat Hammer, President and CEO
The Rogers system tracks five key metrics to ensure we are accountable to our organizational goals.
Clinical Effectiveness
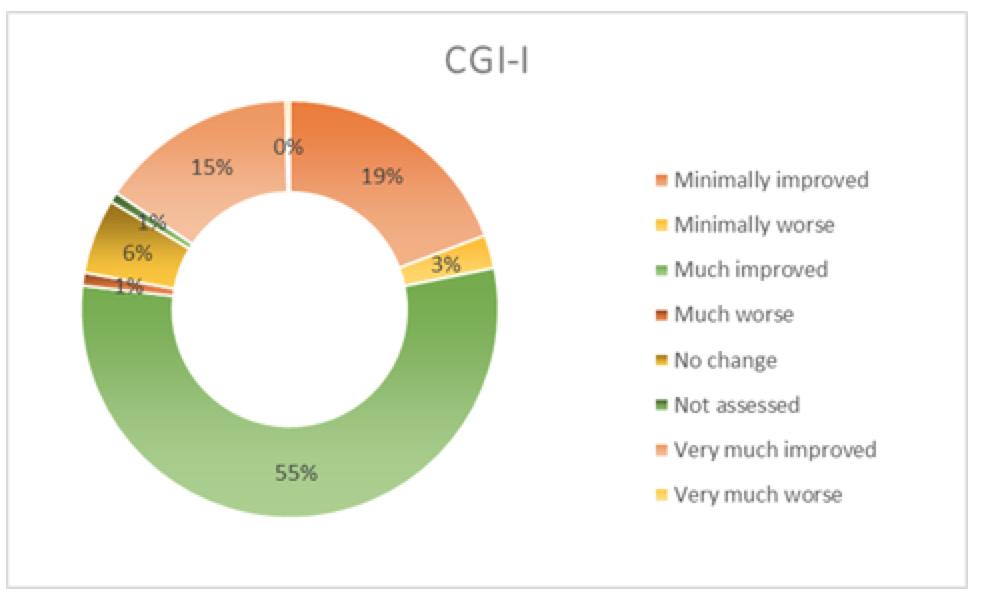
The CGI score is used as the key metric for Clinical Effectiveness. CGI is the clinician-rated assessment of patient severity upon admission and assessment of improvement made at the time of discharge.
-
Year to date Rogers Behavioral Health has collected CGI ratings for 1,699 patients.
-
70% of our patients were “much improved” (55%) or “very much improved” (15%) by the end of their treatment, as rated by the attending psychologist or psychiatrist.
-
Goal: 75 % much improved or very much improved.
Patient Days of Service
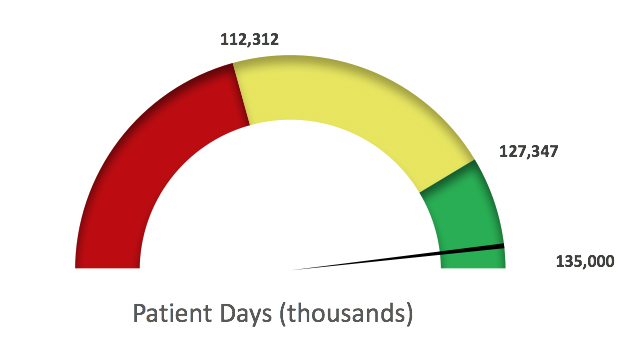
Patient days of service through first half of FY18= 131,199 patient days
Target = 127,347
Compared to fiscal year 2016 = 112,298 (up 17%)
For the second quarter of fiscal year 2018 (November 1, 2017 - January 31, 2018), the number of patient days exceeded the same period last year by 9,601 patient days, or 14%. The year-over-year increase is driven by growth in the following:
- Inpatient 4%
- Residential 15%
- PHP 34%
- IOP 14%
Patient Experience
FY18 Q2 (November 2017 – January 2018)
Inpatient
1,160 surveys 84.1% likelihood of recommending Rogers. (85.5% database mean. 38thpercentile)
Outpatient
764 surveys 91.8% likelihood of recommending Rogers. (91.7% database mean 46thpercentile)
FY17 Q2 (November 2016 – January 2017)
Inpatient
1,070 surveys 85.2% likelihood of recommending Rogers. (85.2% database mean. 45thpercentile)
Outpatient
604 surveys 91.5% likelihood of recommending Rogers. (92.5% database mean 38thpercentile)
Employee Engagement
Measured by results on the employee satisfaction survey.
Results: Rogers’ 2017 composite score was 73 compared to 75.7 last year.
The composite is the average of seven survey questions on satisfaction, pride, and commitment to the job and organization:
-
I am proud to work for Rogers Behavioral Health.
-
I am willing to go beyond the requirements of my job to help the organization succeed.
-
Considering everything, how satisfied are you with your job at the present time?
-
Considering everything, how satisfied are you with Rogers Behavioral Health as a place to work?
-
I feel a strong sense of commitment to Rogers Behavioral Health.
-
I would recommend Rogers Behavioral Health as a good place to work.
-
At the present time, I am seriously considering leaving Rogers Behavioral Health.
“We are committed to continue partnering with employees to create the best possible work and care environment. This is not something that we can accomplish without everyone contributing to sharing ideas and continually working on, but I’m confident that with continued focus, we can continue to positively shape our culture,” says Pat Hammer.
Financial Performance
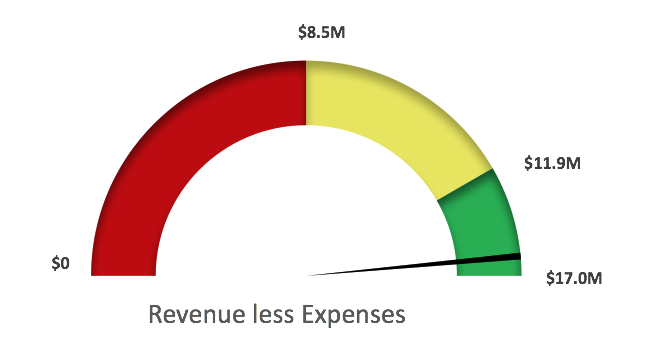
Revenue minus expenses fiscal year-to-date, 2018 = $16.8 million
Target = $8.5 million
Compared to fiscal year 2017 = $11.9 million