
System results for FY22 Q2
02/24/22 03:00:pmTo ensure we are accountable to our organizational priorities for Clinical Effectiveness, Patient Experience, Healthy Culture, Community Outreach, and Financial Sustainability, Rogers tracks key metrics and shares results on a quarterly basis.
Clinical Effectiveness
Rogers is dedicated to enhancing our evidence-based system of care and publishing outcomes that demonstrate that our treatments are highly effective.
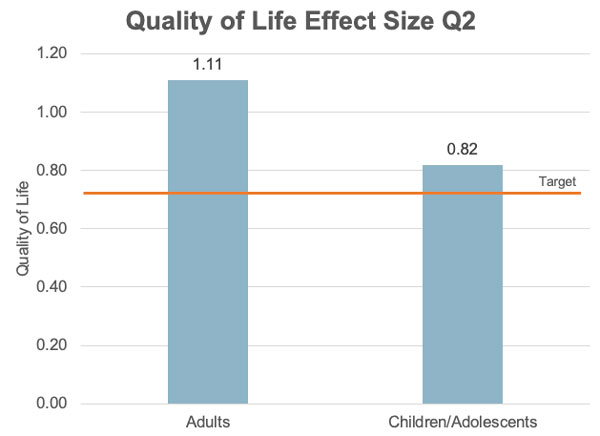
- Quality of Life Enjoyment and Satisfaction Questionnaire self-assessment completed at discharge of each level of treatment by all patients, measuring the degree of enjoyment and satisfaction experienced in various areas of daily functioning. Goal: 0.74 effect size for all patients combined. Effect size is a statistical method of quantifying the improvement someone makes from admission to discharge.
Quality of Life effect size Q2 results
Adults: 1.11
Children and Adolescents: 0.82
"A 0.80 effect size or more is considered a significant improvement in a patient’s quality of life during their treatment stay,” says Brad Riemann, PhD, chief clinical officer/chief operating officer. “This is the number one indicator that the dedication of our treatment teams changes lives.”
Patient Experience
Measures of success
- Days of Care Delivered: 465,454
- Patient satisfaction: 86% or more weighted average of giving a good or very good likelihood of recommending Rogers on the Press Ganey survey.
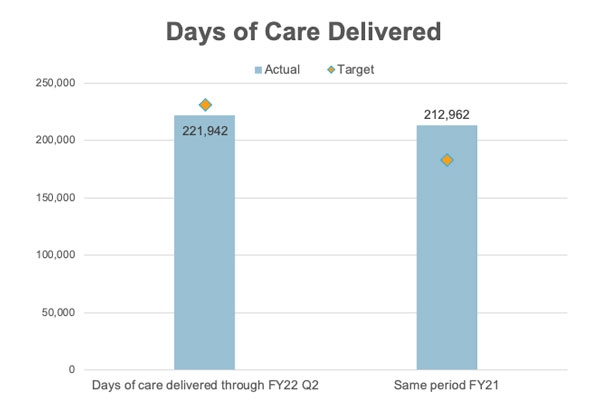
Days of Care Delivered
Days of care delivered through FY22 Q2 = 221,942
Q2 Target = 230,727 patient days
Same period FY21 = 212,962 patient days (up 4.2% this year)
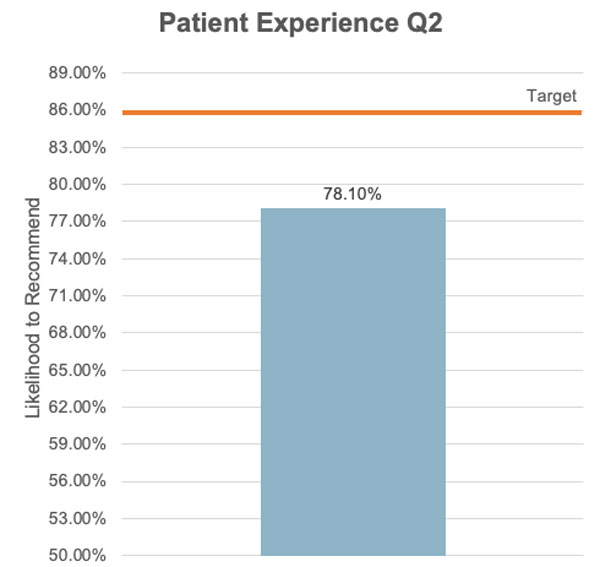
Inpatient: 1,248 surveys; 78.99% (good or very good) likelihood of recommending Rogers
Outpatient: 323 surveys; 81.66% (good or very good) likelihood of recommending Rogers
Combined: 1,571 surveys; 78.10% weighted average likelihood of recommending Rogers
Visiting hours, meals, and admission and discharge processes were the main factors affecting the inpatient score, according to Barbara Brockmeier, interim chief operating officer, hospital services. We expect improvement now that visitors are permitted again, and adjustments have been made to meals.
The admission and discharge flow, overall patient satisfaction, and patient involvement in treatment planning will be addressed as part of Rogers Operating System improvement events this spring.
Healthy Culture
Rogers is committed to building a healthy culture that motivates our employees to perform at a high level and in turn provide the best environment for our patients to recover.
Measure of success
- 73% positive response on 7-question index (average of seven survey questions on satisfaction, pride, and commitment to the job and organization).
Rogers’ overall employee engagement was 74% in the 2020 survey. The next full survey will be offered in late May. A new short “pulse survey” was conducted in late 2021; results will be shared with leaders in the coming weeks.
Community Outreach
Rogers is committed to developing relationships throughout the communities we serve to help build awareness and access to high quality behavioral health services.
Measure of success
- Referring provider likelihood to recommend Rogers. Goal: At least 90% of survey respondents say they will continue to refer and/or recommend Rogers.
More than 900 referring providers from 29 states completed an annual survey last year evaluating their satisfaction with Rogers. Overall, 94% of respondents said they are very likely (57.43%) or likely (36.42%) to refer or recommend Rogers for specialty behavioral health treatment. The next survey was distributed on February 22.
Financial Sustainability
Measures of success
- EBIDA (Revenue minus expenses): $58 million
- Charity Care: Percentage of net revenue at end of fiscal year. Goal: 2.3% (net revenue budget is $342,680,875)
- Total Net Assets of Hospital and Foundation: $571 million
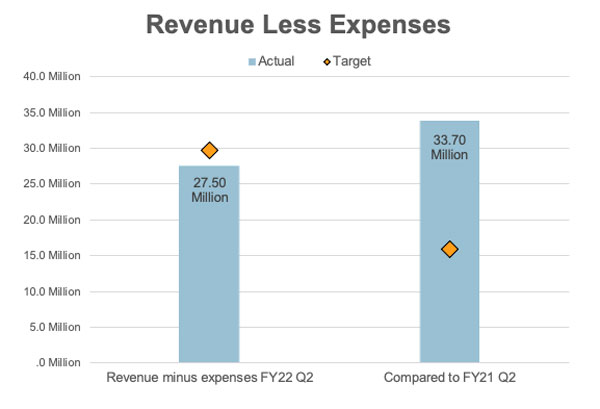
EBIDA through Q2 = $27.5 million
Target = $29.7 million
Compared to FY21 through Q2 = $33.7 million
“Due to the impact of the pandemic and related staffing shortages, we are slightly behind our year-to-date financial goals,” says Pat Hammer, president and CEO. “Overall, we are in a very strong financial position and poised to hit our financial targets in the second half of fiscal year 2022.”
Posted in
Related articles