


Rogers develops a data-driven approach to market assessments
06/17/22 09:27:amThe Data Analytics team recently launched a new mechanism to help Rogers better determine where the demand for behavioral health services is across the country.
A new dashboard integrates population-level data and prevalence rates of mental health and addiction to identify what parts of the United States would benefit from an onsite clinic or telehealth services, as well as what services should be offered.
“This is an exciting, new approach Rogers is taking to inform us on our upcoming expansion plans,” says Jessica Cook, director, Data Analytics. “With this dashboard, we are able to make data-driven decisions to appropriately determine the total addressable market in a state.”
Used by operations, Clinical Innovations, and Continuous Improvement teams, the dashboard forms calculations based on a machine learning model that analyzes multiple sources of data.
The final result of the dashboard visually depicts the prevalence of 20 categories of behavioral health issues in a given location of the country. It also defines potential markets as: excellent, very strong, strong, good, fair, poor, and very poor.
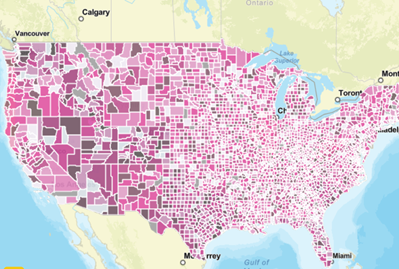
The above graphic is an example of the dashboard not to be interpreted for results.
How the dashboard was developed
The idea to leverage data to make more informed decisions on where Rogers should have a presence was originally put forward by Brian Kay, PhD, vice president, Continuous Improvement, and Dylan Ross, PhD, vice president, Clinical Innovations.
The Data Analytics team then used what is called agile methodology to determine how to make the most robust tool possible.
According to product owner Kaitlin Rouse, this meant applying concepts from the Scaled Agile Framework (SAFe):
- Respect for people and culture
- Flow
- Innovation
- Relentless improvement
“Using SAFe, we wrote a user story and dug into what we needed to find out and the why behind it,” explains Kaitlin. “We had ongoing meetings with the Continuous Improvement and Clinical Innovations teams to make sure the dashboard was meeting the need, and we explored ways to make it even more user-friendly and valuable to a greater number of teams at Rogers.”
Furthermore, the Data Analytics team strived to take advantage of the most advanced machine learning techniques and plan for future industry trends.
For instance, Sala Lotfi, PhD, a data scientist who led the project, says a recent Accenture digital health survey found that 96% of healthcare CEOs intend to use cloud computing within the next three years, and 81% believe the pace of digital transformation for their organizations is accelerating.
“In this particular project, we connected with federal healthcare agencies to obtain publicly available data about the prevalence of mental health disorders and providers of psychiatry and psychology services,” Dr. Lotfi explains. “Together with data from the U.S. Census Bureau, we developed a sophisticated spatial accessibility model that identifies and locates, state- and county-wise, the areas with the highest demand for mental health services but limited access to providers."
While the dashboard provides valuable information, Jessica notes that it is a tool used in collaboration with other critical resources and information. For instance, Rogers will continue to evaluate other factors, including regulatory requirements and primary payors, when making expansion decisions.
“Rogers is committed to investing resources into analytics, and the dashboard is yet another example of an innovative project that sets us apart from other healthcare systems,” Jessica says.
Posted in
Related articles